Figure 4.
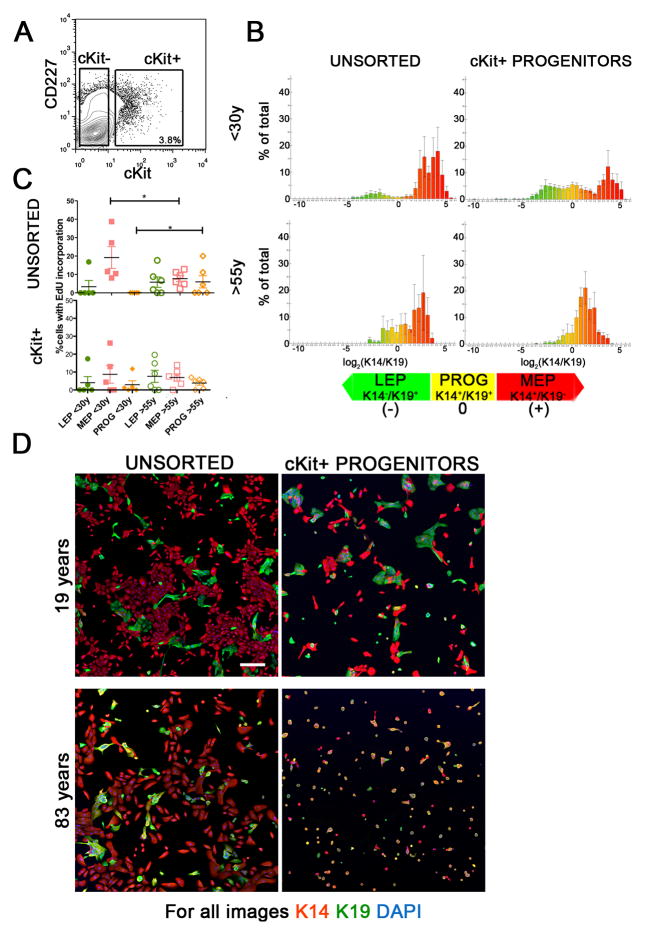
cKit+ progenitors exhibit age-dependent differentiation defects. (A) A representative contour FACS plot from strain 353P, showing the gating logic used to enrich cKit+ from 4th passage HMEC strains. (B) Histograms representing average lineage distributions from five individuals <30y (strains 240L, 407P, 168R, 123, and 124) or five >55y (strains 122L, 881P, 353P, 464P, and 451P) in unsorted HMEC (left column), and cKit+ progenitors (right column) after 48h of culture on tissue culture plastic. Histograms represent log2 transformed ratios of K14 to K19 protein expression in single cells, histograms are heat mapped to indicate cells with the phenotypes of K14−/K19+ LEPs (green) K14+/K19+ progenitors (yellow), and K14+/K19− MEPs (red), error bars represent SD (n=2500 cells/histogram). (C) Scatter plot representing EdU incorporation in the different lineages, as defined by K14 and K19 expression, in (top) unsorted 4th passage HMEC strains and (bottom) cKit+-derived cells after 48h culture. Lines indicate average and error bars represent SEM (n=2500 cells per age group). (D) Representative images of unsorted, CD227- and cKit-enriched HMEC from two individuals, after 48h of culture; Protein expression of K14 (red), K19 (green) are shown, and nuclei are stained with DAPI (blue). Scale bar represents 20μm.

