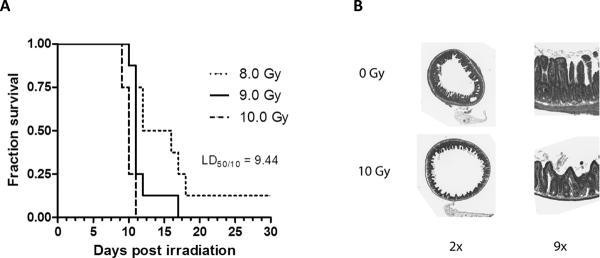
Figure 1. Post-irradiation survival.
-
A)Kaplan-Meier survival curves for mice (8 per radiation dose group) were exposed to 8–10 Gy total body irradiation (TBI) with increments of 0.5 Gy (only 8, 9, and 10 Gy are shown on this graph for clarity). The LD50/10 (radiation dose associated with 50% lethality at 10 days) was estimated by probit analysis to be 9.44 Gy.
-
B)Cross sections and detail of mouse proximal jejunum procured 3.5 days after exposure to sham irradiation (0 Gy) and 10 Gy total body irradiation. Original magnification as indicated on the figure.

