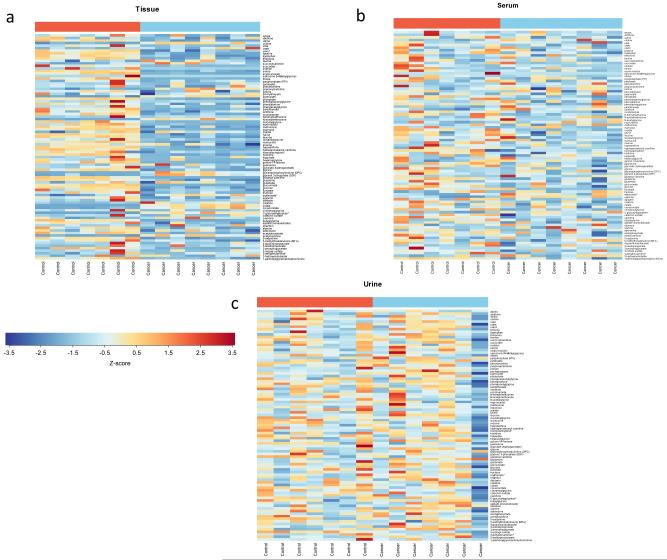
Fig. 3.
Heatmaps for each matrix of the 89 metabolites in common.
The color of each section is proportional to the significance of change of metabolites (red=upregulated; blue=downregulated) in (a) tissue, (b) serum, and (c) urineTissue and serum values are z-scores of raw intensities of each metaboliteFor urine, values are z-scores of creatinine-normalized metabolite intensities in urine obtained 2 days before sacrifice in both cancer and corresponding control animals.

