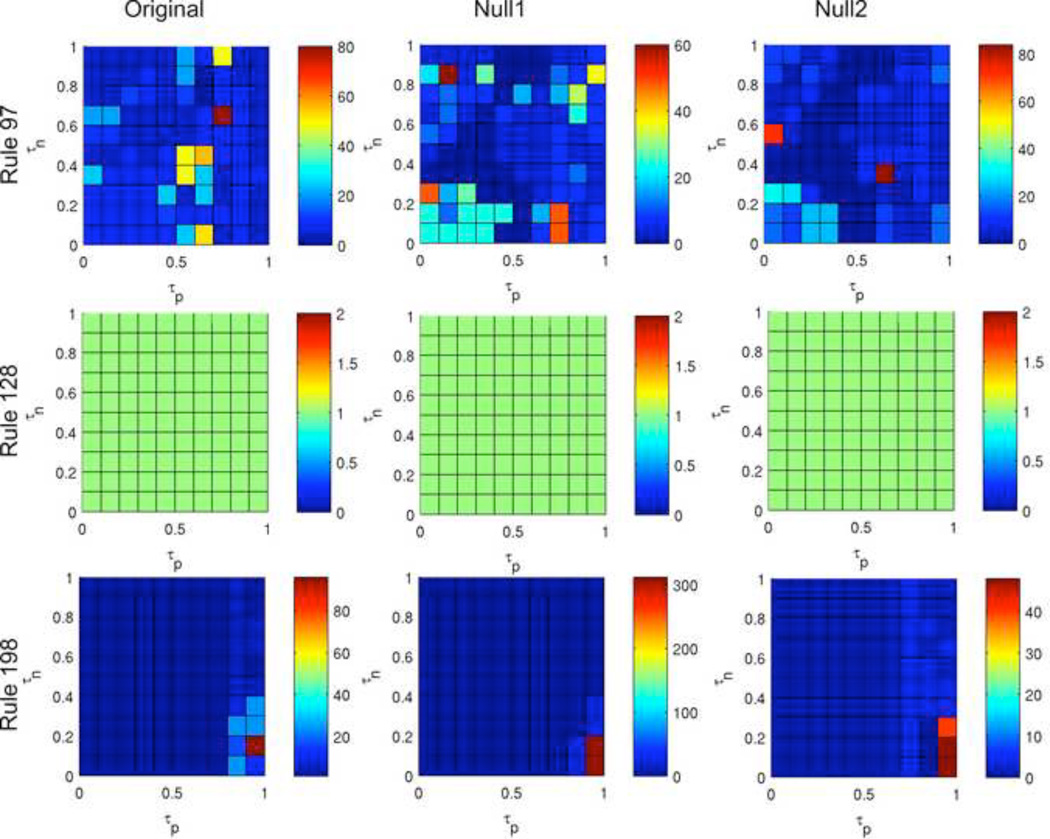
Figure 10. Color maps summarizing period length for three rules.
Outputs for rules 97 (top row), 128 (middle row), and 198 (bottom row) are shown for the original network (left) and the null1 (center) and null2 (right) random models. Each color map was generated using the same initial configuration used in Figure 9.

