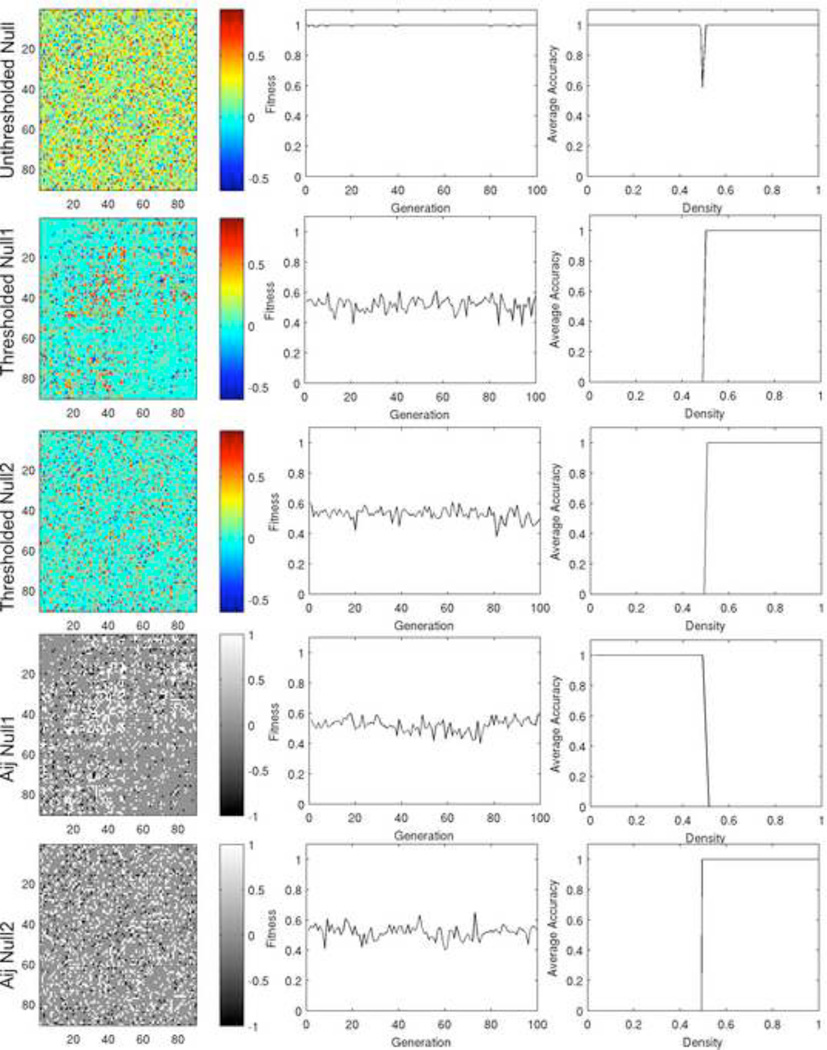
Figure 15. Density classification using null network models.
Results are shown for a fully connected randomized network (row 1), thresholded null1 (row 2) and null2 (row 3) models, and the corresponding binary networks (rows 4 and 5 respectively). The left column shows the connectivity matrix for the null network models. The middle column shows the maximum fitness over generations of the GA. The right column shows the average classification accuracy over a range of densities of on nodes. Only the fully connected null model was able to consistently solve the density-classification problem over a range of densities.

