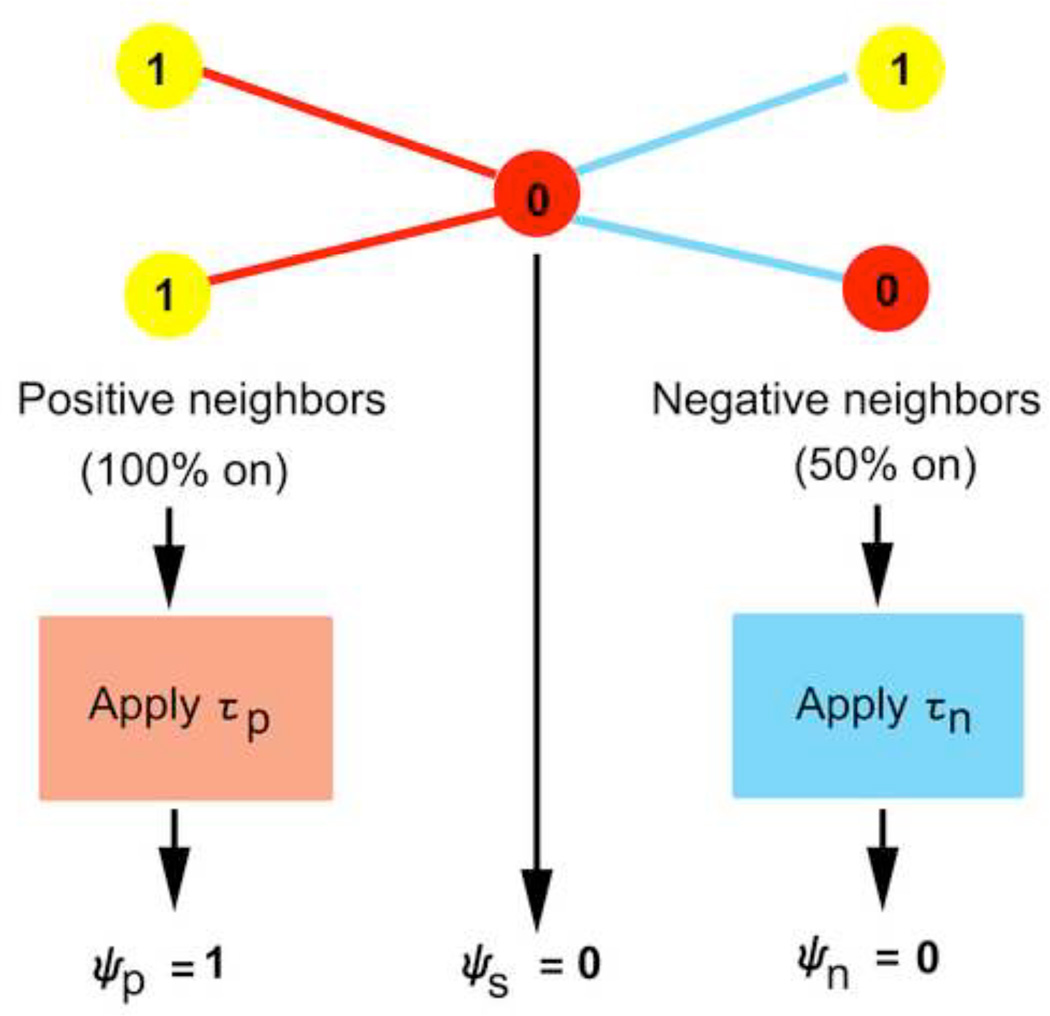
Figure 2. Summarizing the neighborhood of a node into 3 binary bits.
Pictured is the neighborhood for an example node (center node). Red lines indicate positive connections to positive neighbors (two left-most nodes) and blue lines indicate negative connections to negative neighbors (two right-most nodes). Nodes are either on (yellow nodes with values of 1) or off (red nodes with values of 0). The positive bit minimum τp and negative bit minimum τn are applied to the percentage of positive or negative nodes in the on state to determine the value of those bits in the binary neighborhood. In this example, all links are considered equally weighted, but in the ABBM link weights contribute to the percentage of nodes that are on or off.

