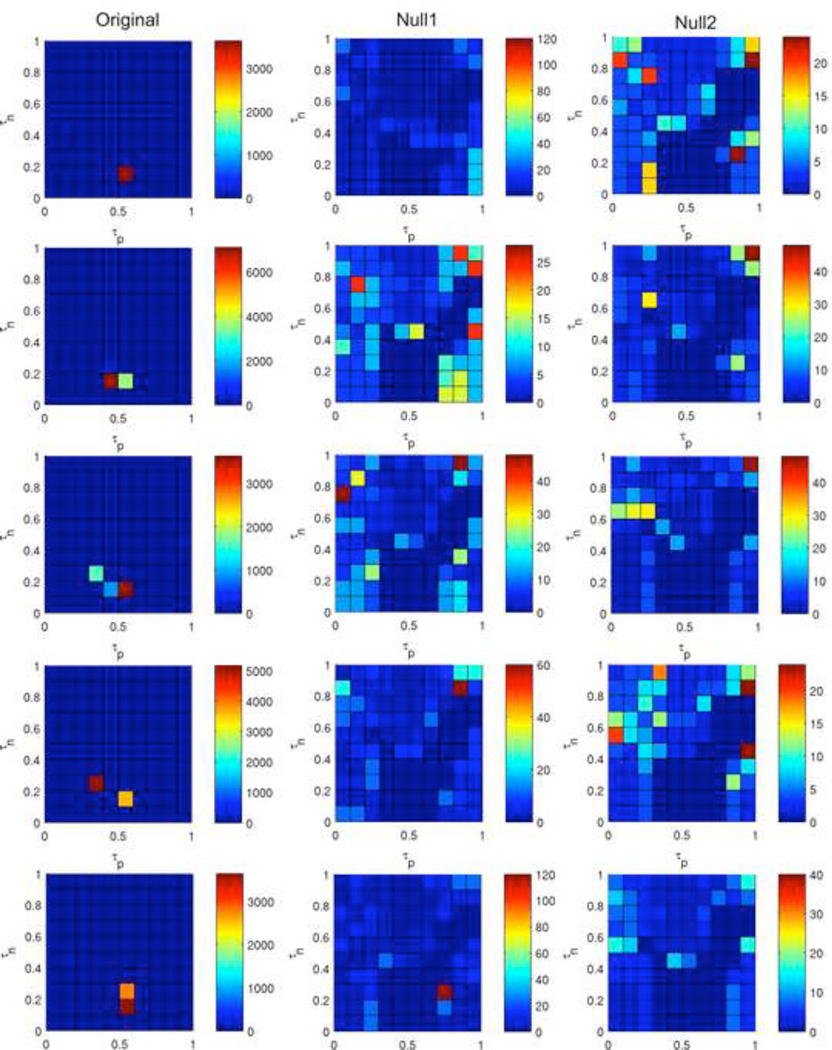
Figure 7. Color maps summarizing the period length of the steady state behavior of the ABBM using Rule 41.
Each color map displays the period length of the steady state behavior, starting from the same five initial configurations used in Figure 6. Maps were generated using either the original brain network (left column), the null1 model (middle column), which randomizes connections while preserving degree distribution, or the null2 model (right column), which is a complete randomization of the network.

