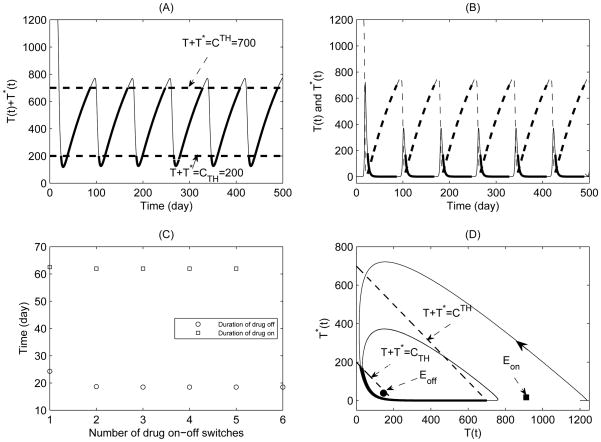
Figure 5.
A simulation of typical solution of systems (9) and (10) with CTH = 200 and CTH = 700 for Case 1. The parameter values are given in Table 1 with ηRT = ηP I = 0.6. (A) Time series of total CD4+ T cell population; (B) Time series of healthy CD4+ T cell population (dashed line) and infected CD4+ T cell population (solid line); (C) Durations of drug on and drug off for each drug-on/off switch; (D) Phase plane plot of healthy CD4+ T cell and infected CD4+ T cell populations

