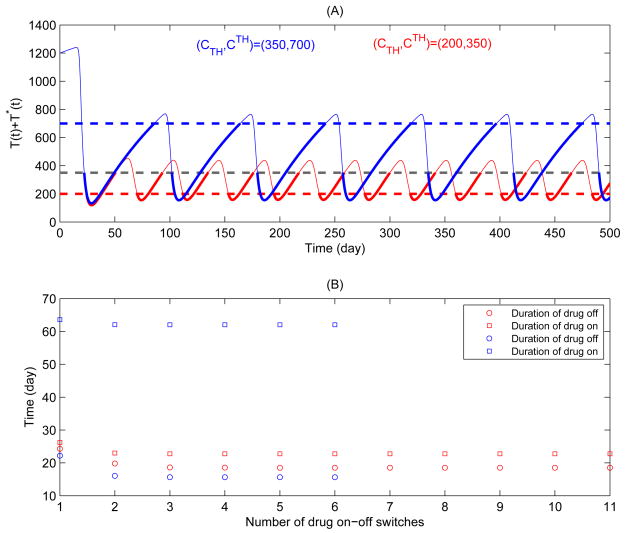
Figure 8.
Numerical simulations of solutions corresponding to SMART and LOTTI studies. The parameter values are identical to Fig. 7. (A) Blue cure for the solution with CTH = 350 μl−1 and CTH = 700 μl−1, pink curve for the solution with CTH = 200 μl−1 and CTH = 350 μl−1; (B) The durations of drug-on and drug-off corresponding to (A) are given.

