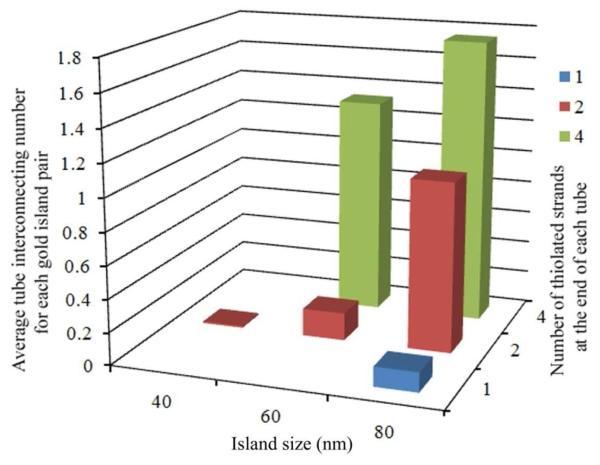
Figure 3.
Graph showing how the binding efficiency depends on both the number of thiol groups at each end of the DNA tube and the diameter of the gold islands. The average interconnection number was calculated by dividing the total number of observed connections by the total number of gold pairs in the image area. The incubation time for all the samples represented in the graph was 20 hours; DNA tube concentration was 2 nM. Note the flat square corresponding to the 40 nm island indicates zero because we observed no DNA nanotube binding in this case.

