Fig. 3.

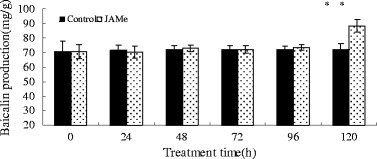
Effects of JAMe treatment on baicalin production in S. baicalensis seedlings. Vertical bars represent the mean ± SD (n = 6). Means with asterisks indicate significant differences at p < 0.05

Effects of JAMe treatment on baicalin production in S. baicalensis seedlings. Vertical bars represent the mean ± SD (n = 6). Means with asterisks indicate significant differences at p < 0.05