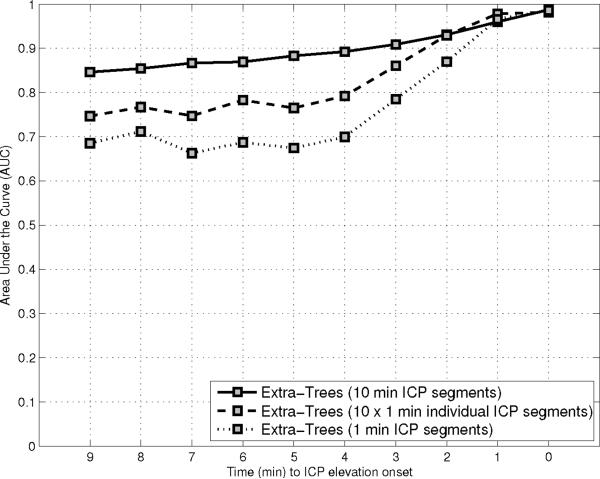
Figure 7.
Illustration of the Area Under the Curve (AUC) after a leave-one-out crossvalidation for three different learning strategy of the Extra-Trees models. The first model is trained on a series of 10 one minute long segments concatenated to a single input vector xi = {α1+ρ, …, α10+ρ}. The second strategy consists in learning ten different models on each one minute long segment and then fuse their output using an arithmetic mean. Finally, the last one is build a single one minute long length segment xi = {α0+ρ}. Al-though, the use of 10 individual classifier improves the overall performance, an additional increase in AUC is observed by using all the 10 vectors at the same time. This indicates that the relative values of successive morphological vector contain relevant precursors of IH.

