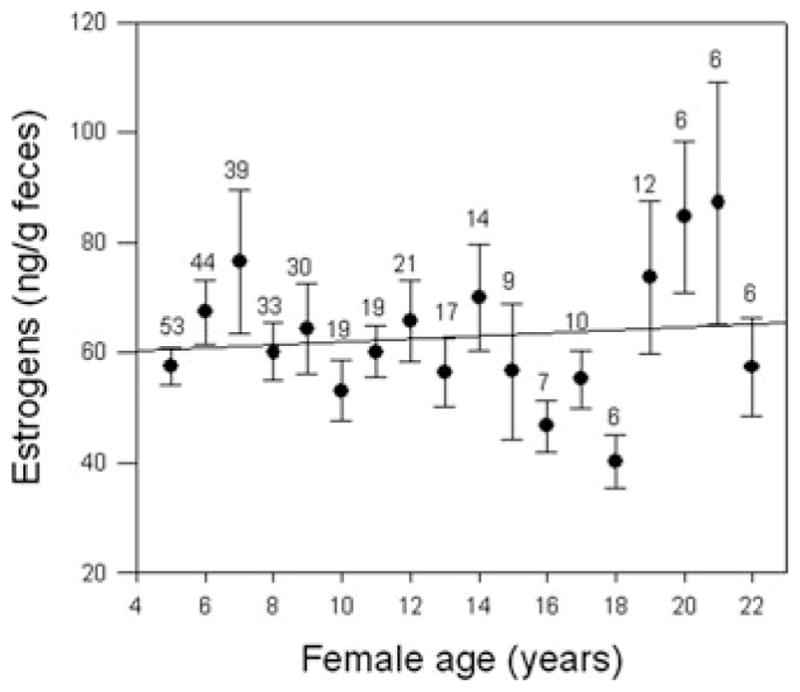
Figure 3.

Estrogen concentrations for baboon females are stable into relatively old age, following a similar pattern to that for female birth rates. The plotted value and bars for each year represent the mean and SE across all cycling individuals (pregnant and lactating individuals were excluded). Within any year, each female is represented by only a single data point, which is calculated as the mean of all values obtained for that female during that year of age. The number of individuals contributing to the data for each age appears just above the error bar for that age.
