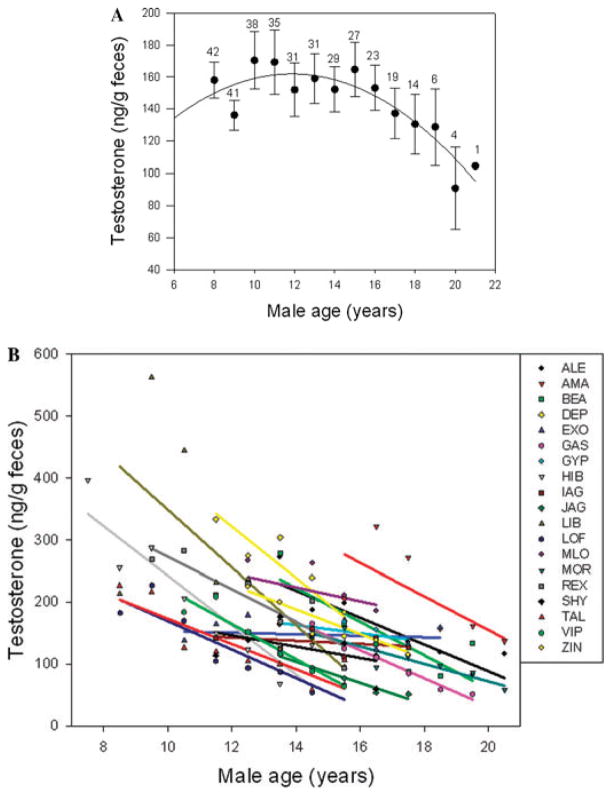
Figure 4.
(A) Testosterone concentrations decline with age for baboon males in our sample, starting by mid-adulthood (see Fig. 3 for the contrasting pattern in females). Calculations and symbols as in Figure 3. (B) The population-level decline with age in testosterone concentrations can be explained by decline with age for individual adult male baboons across adulthood (at least 5 years of data for each male). Only 2 of 19 males did not exhibit a pattern of decline.

