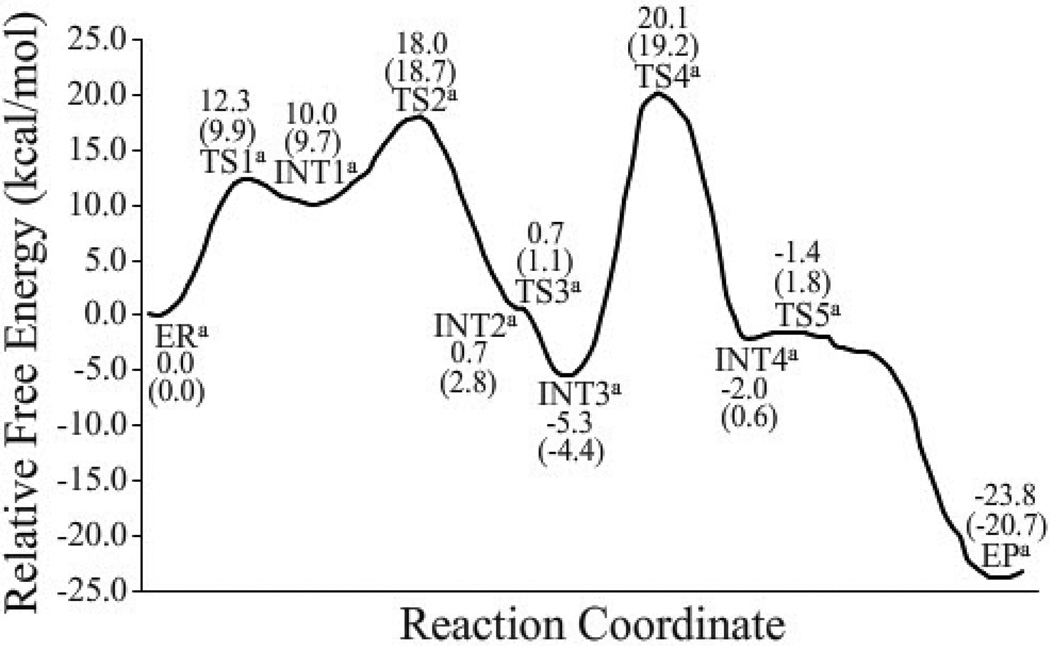
Figure 8.
Free energy profile determined by the QM/MM-FE calculations for the most favorable inhibition reaction pathway associated with the direct proton transfer. There were 113 points (structures) along the reaction coordinate used in the FEP calculations. The relative free energies were determined first without zero-point and thermal corrections, and then corrected with the zero-point and thermal corrections for the QM subsystem (values in parentheses). The QM/MM-FE calculations were performed at the B3LYP/6-31++G**:AMBER level for each QM/MM optimized geometry along the reaction path.

