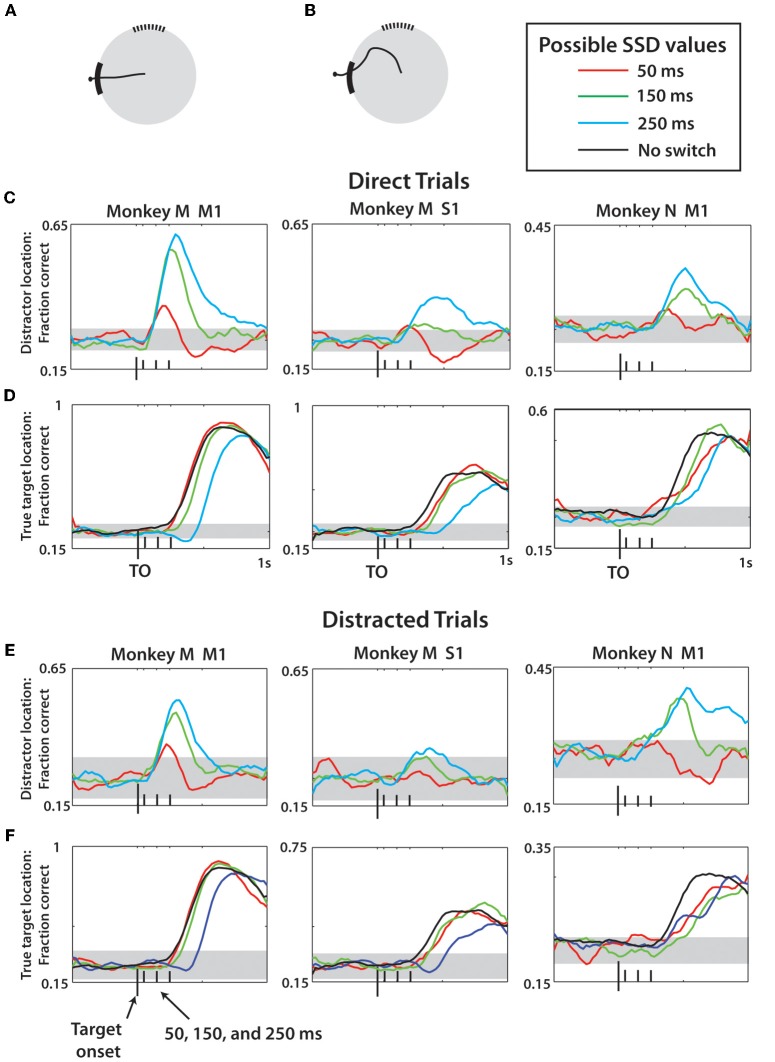
Figure 11.
LDA prediction of distractor and true target separated by movement type. (A) Example of a direct trial. (B) Example of a distracted trial—see Methods for more details. For (C–F), the prediction methods and display are the same as Figure 10. All reported data is actual fraction correct minus fraction correct from shuffled data, plus chance level fraction correct (0.25). (C,D) Predictions of distractor (C) and true (D) target location made using data only drawn from direct trials for monkey M M1, monkey M S1, and monkey N M1 (left to right). Different SSD groups denoted by colors, see Legend. (E,F) Same as (C,D) except data reflects only predictions made for distracted trials. Horizontal gray bands indicate 95% confidence intervals generated by 1-proportion z-test.

