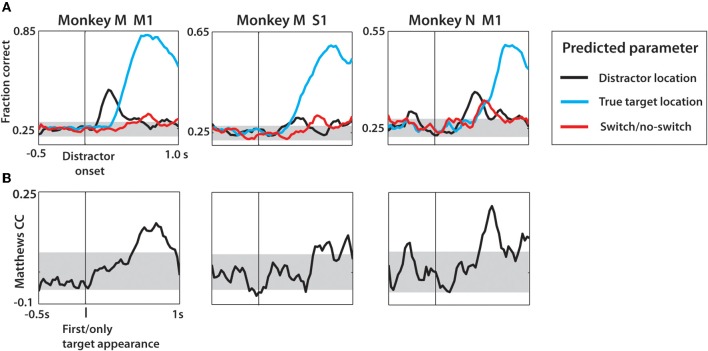
Figure 12.
Decoding of target location and switch/no-switch occurrence from neural activity during task interval, not separated by SSD. (A) Linear discriminant analysis predictions of location of distractor target (black) and second target (cyan) as well as switch/no-switch (red). Data aligned on distractor onset shown with vertical black line. Values shown are fraction correct prediction at each time step of the sliding window. Gray horizontal band is the 95% confidence interval generated using the 1 proportion z-test. (B) Matthews correlation coefficient shown over the task interval. Data are aligned on the distractor appearance. Confidence interval generated from mean ± 2 standard deviations obtained from distribution of MCC from data with shuffled group information prior to LDA predictions.

