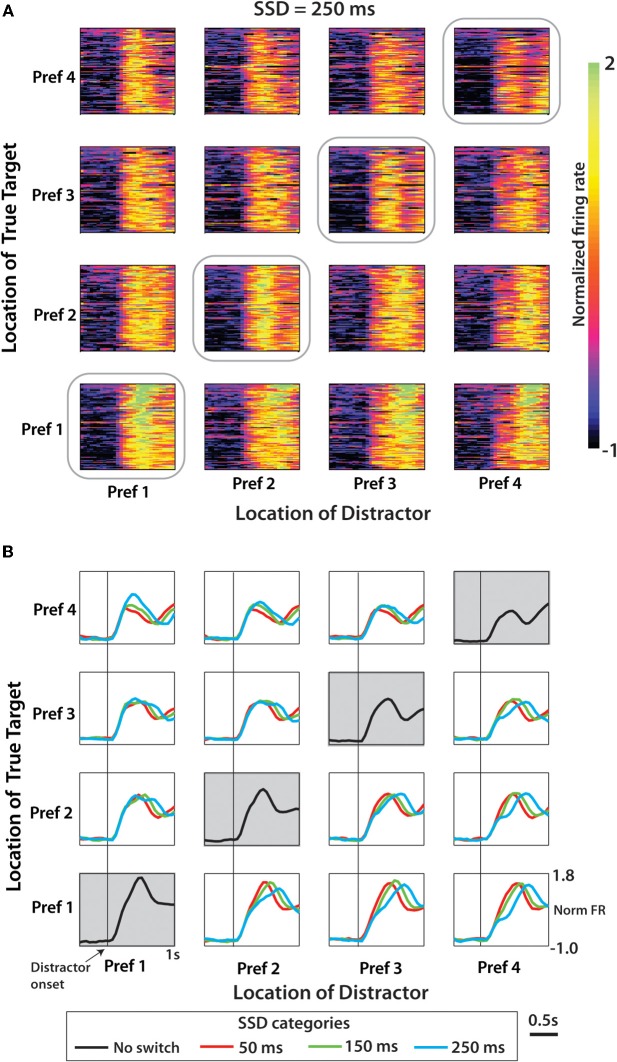
Figure 6.
Population activity from M1 neurons in Monkey M aligned on distractor target onset. (A) Normalized firing rate for each cell and each pairwise combination of distractor and true targets shown for the SSD of 250 ms condition. Amplitude of firing shown by color scale (on right) interpreted as the z-score. Position within the 4 × 4 grid for each cell determined separately according to directional preference order. Data along the diagonal is from no-switch trials. (B) Population mean PETH for each of the three SSD conditions. Time-series data averaged across neurons within a specific condition (within one box on the 4 × 4 grid) organized by neuron directional preference ranking. Along the diagonal is mean population PETH for no-switch trials.

