
Figure 1.
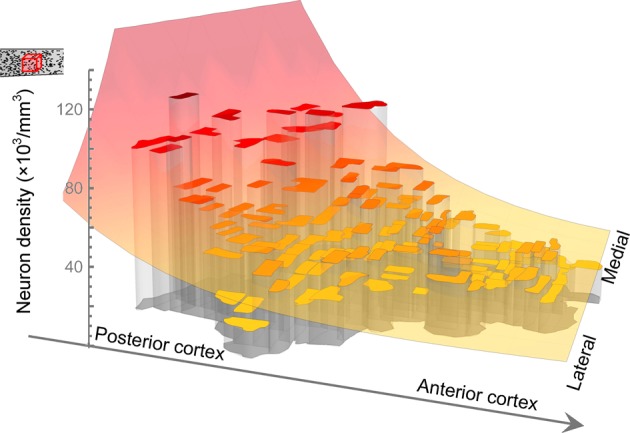
Fitting a model to neuron density recorded in each sample in baboon. Collins et al. removed and flattened the entire cortical sheet, cut it into samples and measured the density of neurons and number of neurons in each. The outlines of the samples of Collins et al. are as represented here and the height of each surface indicates the density of neurons measured in the corresponding sample. Also illustrated is the model function, increasing along an axis from anterior-lateral to posterior-medial cortex, which we have fitted to describe the global trend in neuron density.