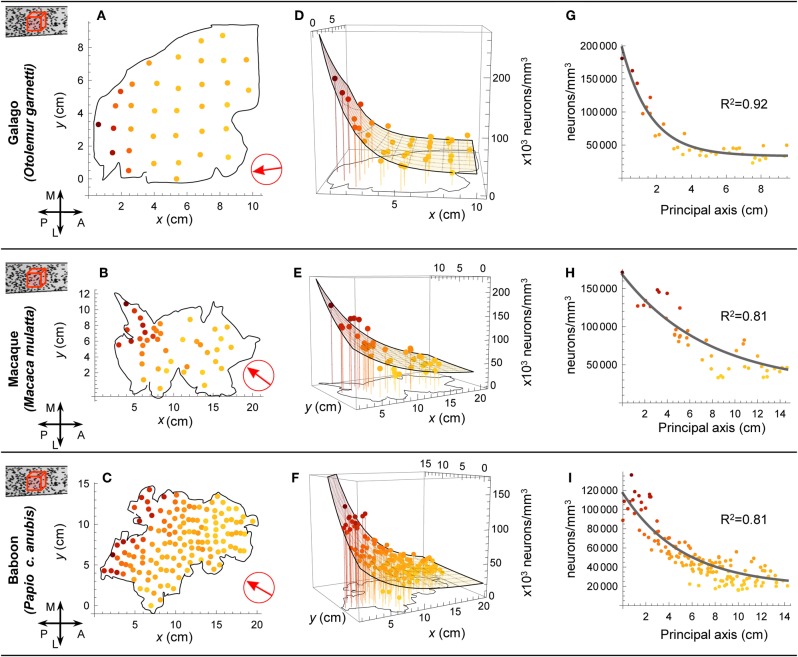
Figure 2.
Modeling neuron density. In three primate species Collins et al. dissected the cortex into multiple samples and recorded the density of neurons in each dissected piece. In (A, B, and C) we denote the locations of the samples on the flattened cortical sheet. We fitted model surfaces (D,E,F) which allowed us to project the data onto a principal axis of variation (G,H,I). In (A,B, and C) the red arrow indicates the alignment of the principal axis. A: anterior; P: posterior; M: medial; L: lateral.

