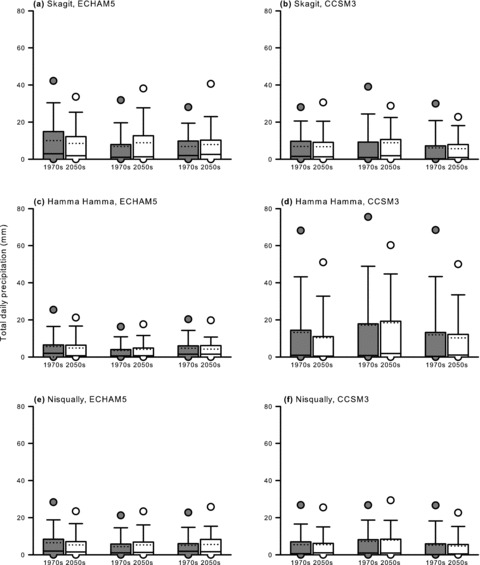
Figure 3.

Mean daily precipitation by site, model, month, and decade. Plots indicate median (central solid line), grand mean (central dashed line), 25th and 75th percentiles (boxes), 10th and 90th percentiles (whiskers), and 5th and 95th percentiles (solid circles).
