Figure 4.

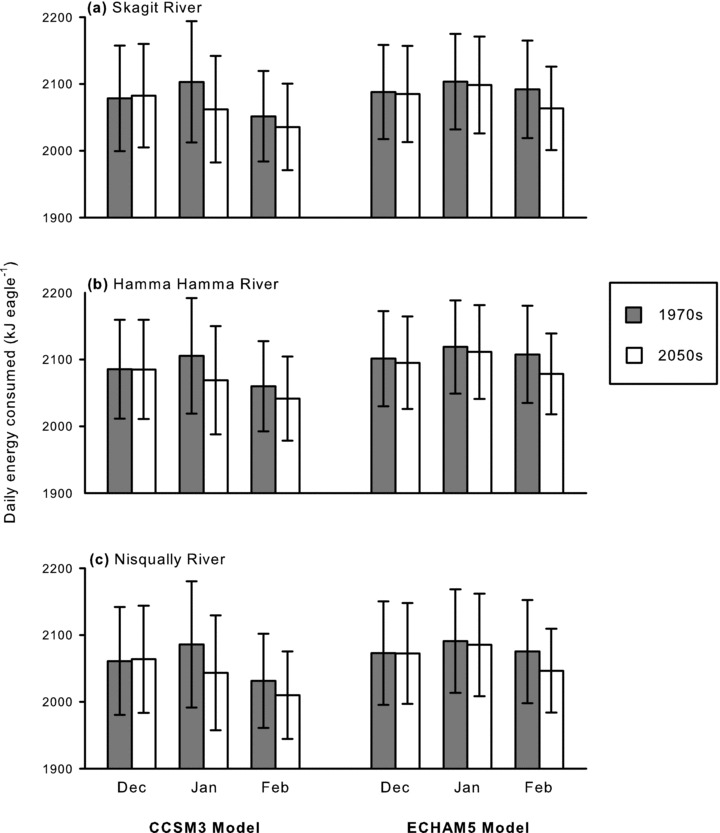
Mean daily bald eagle energy consumption (± standard deviation), calculated with bioenergetics models and plotted by site, model, month, and decade.

Mean daily bald eagle energy consumption (± standard deviation), calculated with bioenergetics models and plotted by site, model, month, and decade.