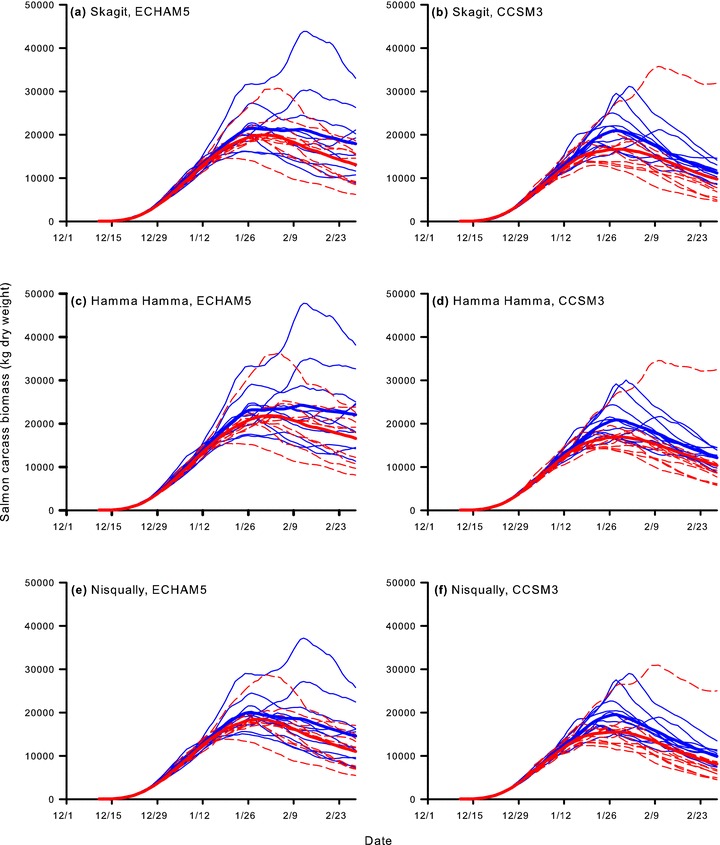
Figure 5.

Estimated daily chum salmon carcass biomass (dry weight), plotted by site and model. Each line represents total carcass biomass from a hypothetical run of 40,560 adult chum salmon during the 1970s (blue lines) or 2050s (red lines). Biomass estimates were based on new additions of fresh carcasses and temperature-mediated daily decomposition of carcasses. Heavy central lines represent mean values by decade.
