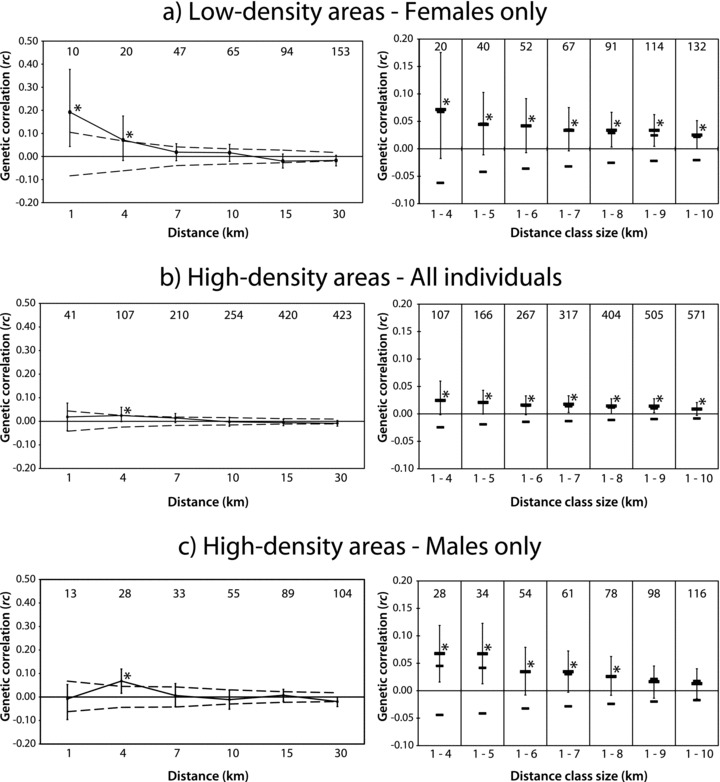
Figure 2.

Left panels: correlogram plots of the genetic correlation coefficient (rc) across low-density and high-density areas of black bear as a function of geographic distance. For simplicity, only correlograms depicting significantly positive rc values (coded by asterisks) within the 4-km distance class are shown. All individuals with identical spatial coordinates fall within the 1-km distance class. (a) Low-density areas – females only (n= 40); (b) high-density areas – all individuals (n= 76); (c) high-density areas – males only (n= 36). The 95% confidence interval for the null hypothesis of a random distribution of genotypes (dashed lines) and the bootstrapped 95% confidence error bars are also shown. The number of pairwise comparisons within each distance class is presented above the plotted values. Right panels: graphs showing the influence of different second class sizes on the spatial autocorrelation analyses for cases considered in the left panels. Only the second distance class is shown, for increasing distance class sizes from 4 to 10 km. The thicker line denotes the genetic correlation coefficient (rc), and the thinner lines indicate lower and upper bounds of the 95% confidence interval for the null hypothesis of a random distribution of genotypes. Bootstrapped 95% confidence error bars are also shown. The number of pairwise comparisons within each distance class size is presented above the plotted values. Asterisks denote significantly positive rc values (P < 0.05).
