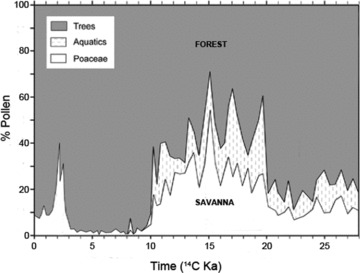
Figure 3.

Fossil pollen profile for Lake Barombi Mbo displaying changes in forest coverage since the Late Pleistocene in the geographic range of Mandrillus leucophaeus (modified from Bonnefille 2007). Present day is on the left on the x -axis. Forest pollens decrease and savanna pollens increase during the Last Glacial Maximum (LGM) and during an arid period in the Mid-Late Holocene. Pollens from aquatic vegetation also rise during cold and/or dry periods as lake levels drop.
