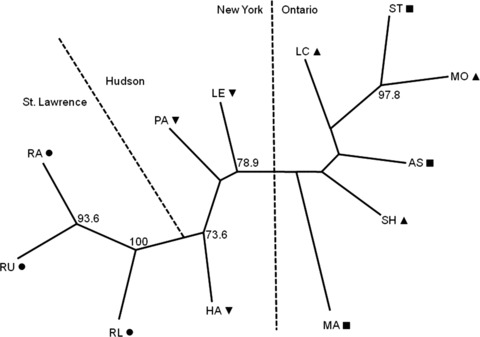
Figure 3.

Phenogram depicting relationships among the 12 lake populations of pumpkinseed sunfish sampled from Central Ontario and the Adirondack region of New York State. Superscripts correspond to drainage systems: Ottawa R. drainage of Ontario (▪); Trent R. drainage of Ontario (▴); St. Lawrence R. drainage of New York (•); Hudson R. drainage of New York (▾). Relationships were inferred from a matrix of Dce genetic distances and the Neighbor-joining algorithm. For 1000 bootstrap replicates, node values of 50% and higher are shown. This analysis grouped population from Ontario together with 78.9% bootstrap support, populations from the St. Lawrence drainage of New York with 100% bootstrap support.
