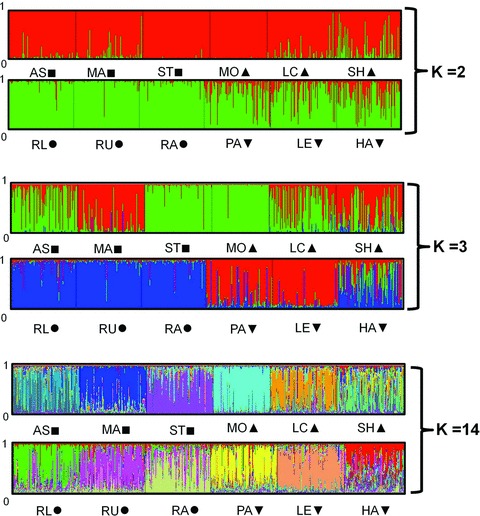
Figure 4.

Bar plot of membership proportions for all individual from the 12 lakes (represented by abbreviations, see methods) in this study using STRUCTURE for K= 2, K= 3, and K= 14 (most likely). Symbols correspond to drainage systems: Ottawa R. drainage of Ontario (▪); Trent R. drainage of Ontario (▴); St. Lawrence R. drainage of New York (•); Hudson R. drainage of NewYork (▾).
