
Figure 5.
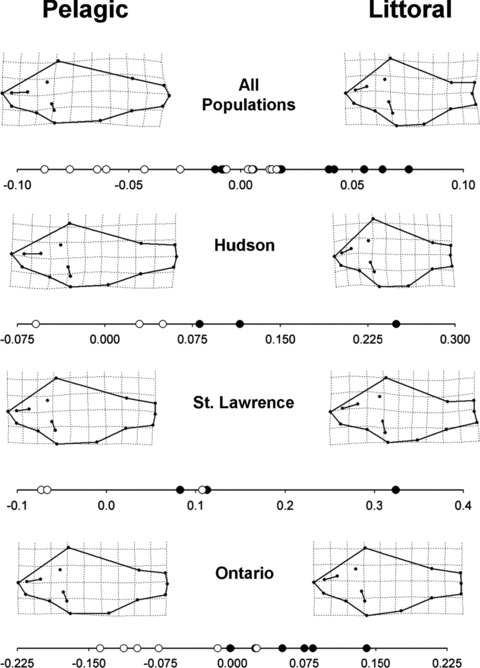
Shared features of body shape divergence between pelagic and littoral ecomorphs of pumpkinseed. Circles (filled = littoral, open = pelagic) indicate a particular population's mean canonical value extracted from the “ecomorph” canonical axis of the MANCOVA analyses (see Methods section). Thin-plate spline transformations represent the most extreme deviation from the consensus configuration (magnified ×2), and were generated by regressing canonical scores against shape data (X–Y coordinates) using TPSregr. As a result of finding significant interactions between ecomorph and genetic cluster in our analysis that included all populations (see Results), we also visualized divergence within each genetic cluster (St. Lawrence, Hudson, and Ontario).