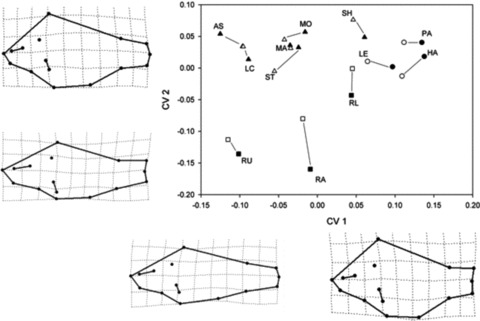
Figure 6.

Features of body shape variation associated with genetic cluster membership (Ontario, St. Lawrence, and Hudson—see Results). Shapes represent different genetic clusters (filled = littoral ecomorphs, open = pelagic ecomorphs), triangles are Ontario populations, circles are Hudson populations, and squares are St. Lawrence populations. The x -axis represents mean body shape variation depicted by canonical variate 1 (CV1), the y -axis represents mean body shape variation depicted by canonical variate 2 (CV2), which were both extracted from the MANCOVA analysis that considered all populations (see Methods). Thin-plate spline transformations represent the most extreme deviation from the consensus configuration (magnified ×2) and were generated by regressing canonical scores against shape data (X–Y coordinates) using TPSregr.
