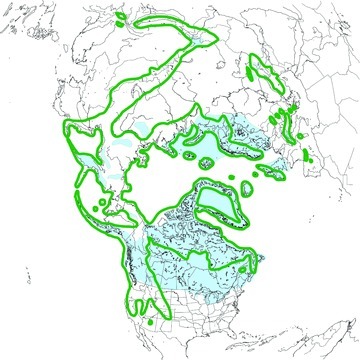
Figure 2.

Worldwide geographic distribution of Oxyria digyna (green outline) and maximum extent of ice sheets during the Last Glacial Maximum (blue shading). Range map is redrawn from Hultén (1971) and glacial boundaries from Ehlers and Gibbard (2007).
