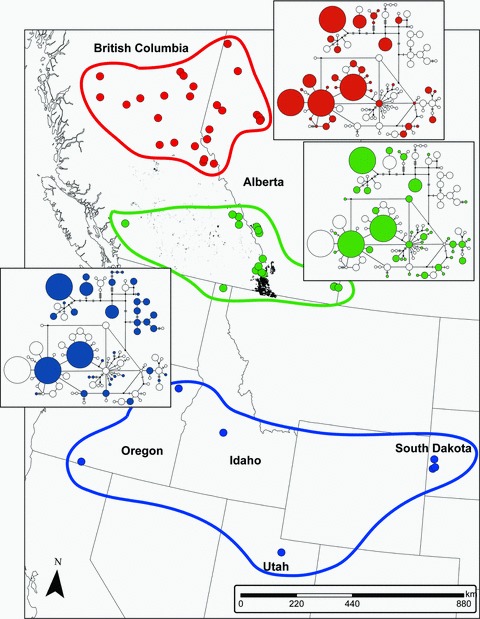
Figure 2.

Sample sites, including data from Mock et al. (2007) divided into south (blue), central (green), and northern (red) groups. Beetle attack data for British Columbia and Alberta up to 1970 are included as shading as an indicator of the historic range postglaciation in Canada. The haplotype Median-Joining network for D. ponderosae is included, where the presence of a haplotype is indicated for each group. Circles are proportioned based on sample size. Sample sites in Arizona and California from Mock et al. (2007) are not shown. Beetle attack data are from Thandi and Taylor (unpubl. ms.).
