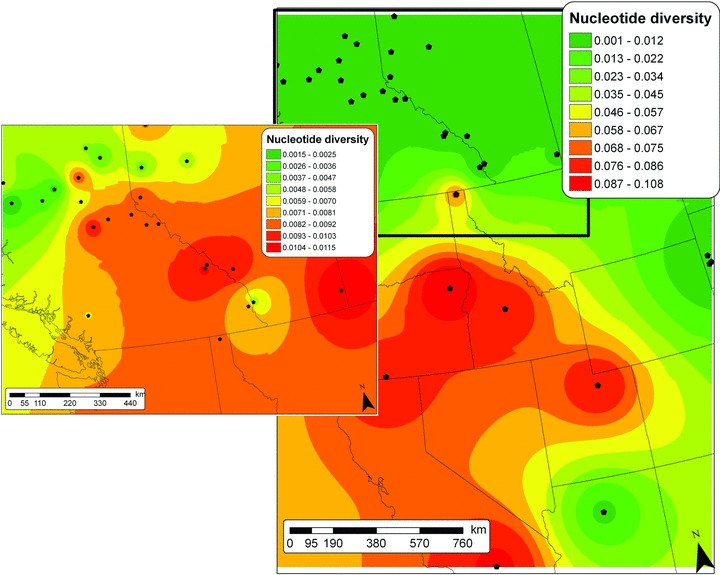
Figure 3.

Spatially interpolated surface of mt nucleotide diversity for MPB populations across western North America, generated using inverse-distance weighting in the spatial analyst extension of ArcMap9.2. Inset shows the central and northern populations at a finer scale.
