
Figure 5.
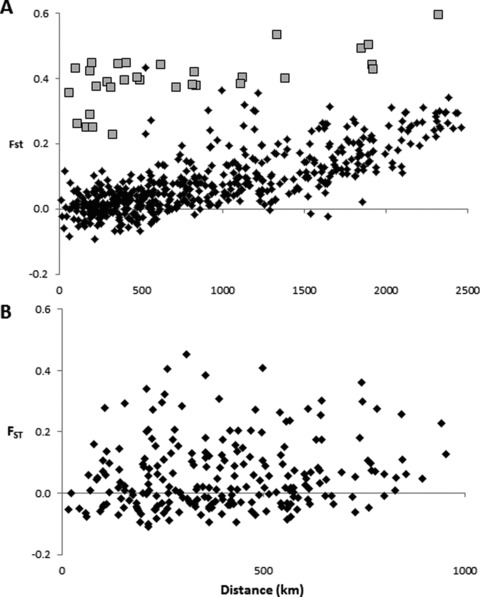
Isolation by distance plot for D. ponderosae across (A) western North America; and (B) our sample areas in British Columbia and Alberta. Geographic distance is significantly correlated to genetic differentiation (FST) across the entire region (r= 0.64, P= 0.0001), though more weakly among the outbreak populations alone (r= 0.30, P= 0.0033). Comparisons with FSJ-BC are indicated by gray squares.