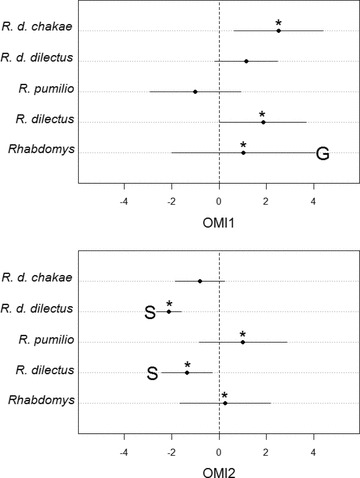
Figure 3.

Niche position and breadth along the first three environmental Outlying Mean Index (OMI) axes for each Rhabdomys lineage. Values near 0 indicate environmental conditions near the available average conditions for that environmental gradient, whereas values far from this origin indicate marginal environments, that is, environments that are far from the environmental mean conditions. The asterisk indicates that the niche position is significantly different than that expected by random placement of the same number of occurrences (bootstrap two-tailed test, P < 0.05). S indicates that the niche breadth is significantly narrower than expected by chance (S = specialist); G indicates that the taxon shows a significantly wider niche breath than expected by chance (G = generalist) (bootstrap two-tailed test, P < 0.05).
