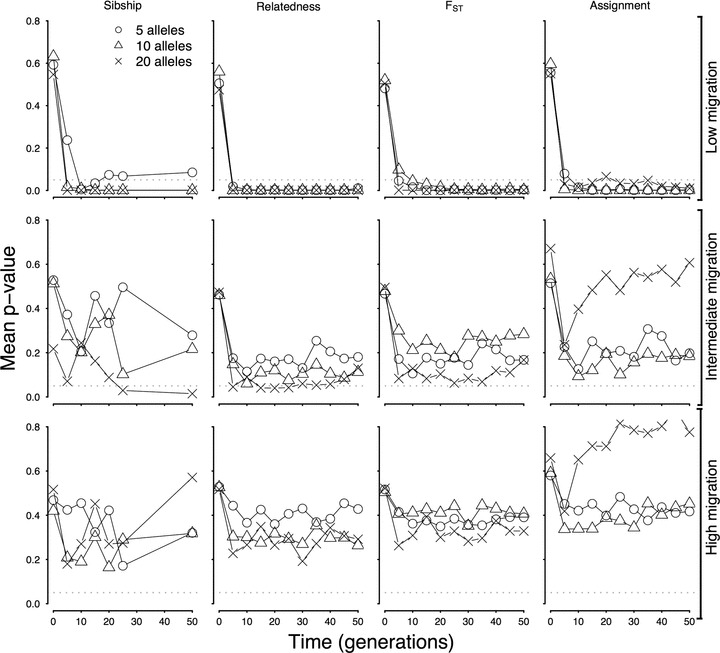
Figure 2.

The effect of the number of alleles on significance of tests for genetic structure using four different methods, under three different migration conditions. The top row shows data from simulations with low levels of migration (probability of migration of 0.04); the middle and bottom rows show data from simulations where individuals have probabilities of migration of 0.1 and 0.2, respectively. The symbols indicate indicates the number of alleles (5 = circles, 10 = triangles, 20 = crosses) at each of 10 loci.
