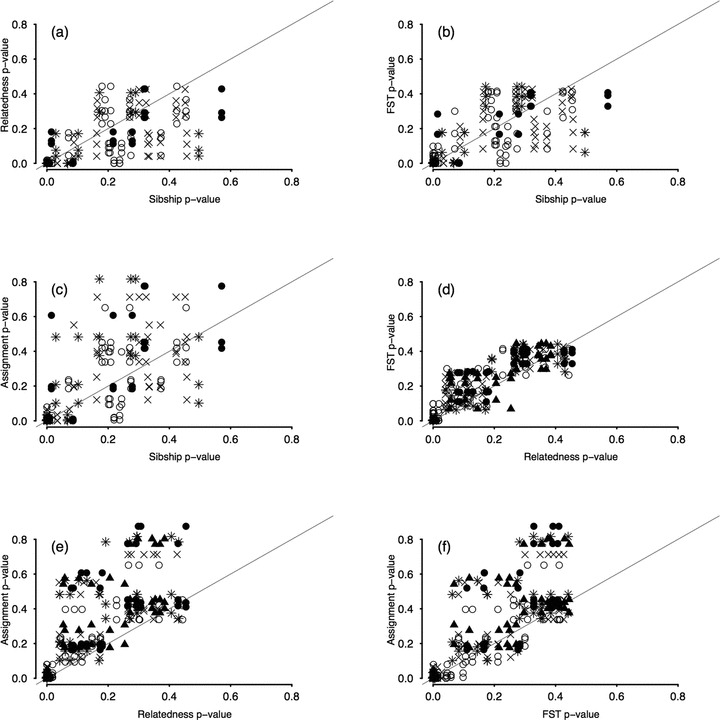
Figure 3.

The association between the P-values produced by the four methods. The symbols used for the points indicate the number of generations that have elapsed (1–10 = open circles, 11–20 = crosses, 21–30 = asterisks, 31–40 = filled triangles, 41–50 = filled circles). The plot includes points from simulations with 5, 10, and 20 alleles.
