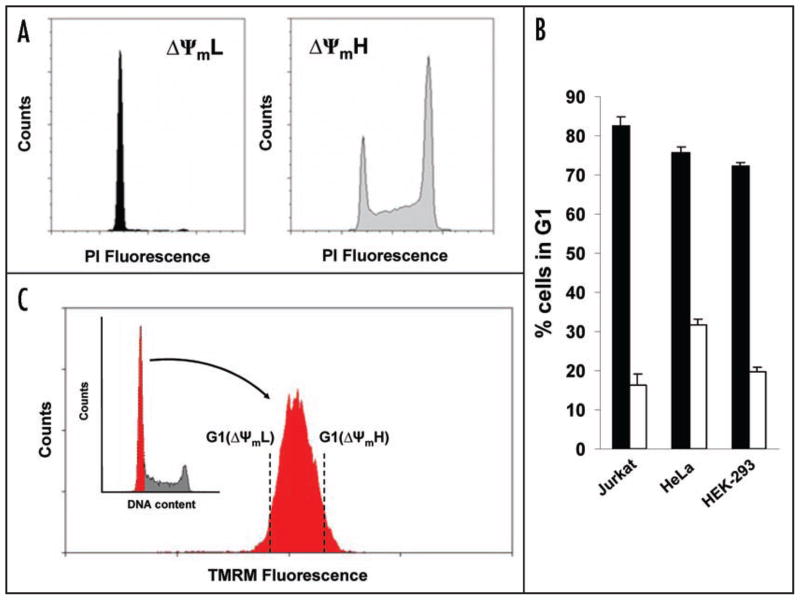
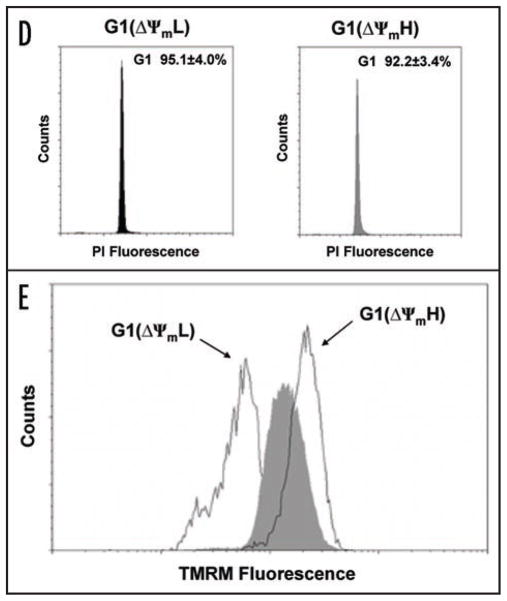
Figure 1.
Variation of mitochondrial membrane potential during cell cycle progression. (A) Cell cycle distribution as assessed by propidium iodide (PI) fluorescence of Jurkat cells sorted initially for low (ΔΨmL) or high (ΔΨmH) mitochondrial membrane potential using TMRM. (B) Exponentially growing cultures from three different established cell lines were sorted based on TMRM fluorescence. Shown is the percentage of the sorted ΔΨmL (shaded bars) or ΔΨmH (open bars) cells that were in the G1 phase. (C) Sorting strategy for G1 cells with low and high ΔΨm. G1 purified cells denoted in red, were subsequently analyzed for mitochondrial membrane potential as assessed by TMRM fluorescence. (D) Cell cycle analysis of G1 cells sorted for low and high ΔΨm with quantitative post-sort purity derived from four independent experiments (mean ± SD). (E) Post-sort analysis of ΔΨm of G1 cells sorted for low and high membrane potential compared to unsorted G1 cells (shaded area).


