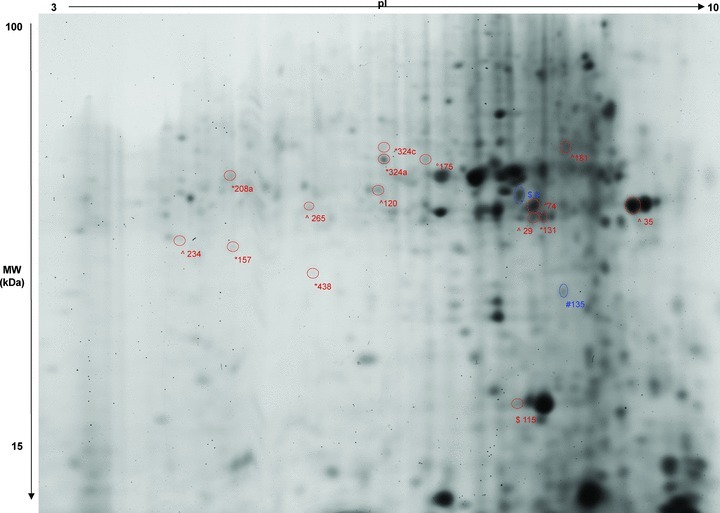
Figure 2.

A representative 2D electrophoresis Coomassie-stained gel for protein extracted from infected larvae (replicates comprised of 10 pooled larvae from each treatment, with 26 µg of sample loaded on to each gel). The spot numbers indicated correspond to the proteins identified in Table 1 with modified abundance in the infection treatments. Protein spots shown in red were upregulated, and those in blue downregulated, relative to the uninfected control. Infection treatments with differential protein abundance on the different sampling days are indicated as follows *the single V. culicis treatment on day 5; ∧ the single V. culicis and the single E. aedis treatments on day 5; ° the single V. culicis and the single E. aedis treatments on day 5 and day 15; $ the single E. eadis treatment on day 15 and the coinfection treatment on day 15; and # the coinfection treatment on day 15 infection.
