
Figure 9.
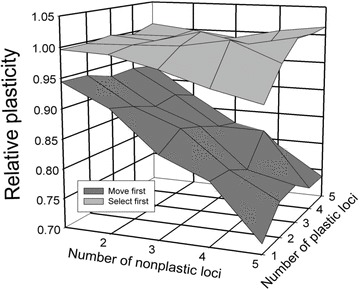
The effect of genetic architecture on the evolution of phenotypic plasticity. A value of 1 indicates that the metapopulation converged to a pure plasticity outcome; values less than that indicate that the average reaction norm had a slope intermediate between the two pure outcomes. For these simulations, the dispersal rate was 32%.