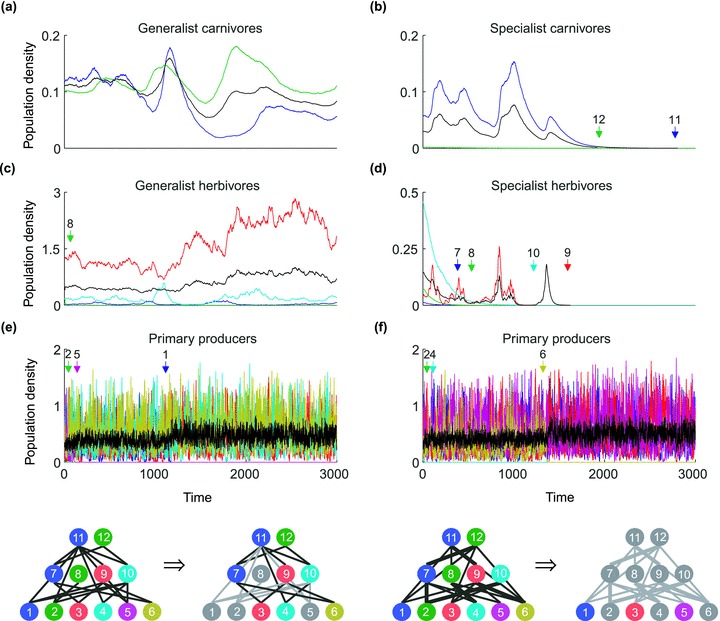
Figure 5.

Examples showing the disassembly of 12-species food webs with generalist consumers (left panels) and specialist consumers (right panels). Top panels (a, b) show time series for carnivores, middle panels (c, d) show time series for herbivores, and bottom panels (e, f) show time series for primary producers. Black trajectories show time series for the mean density of species at each trophic level. Density compensation as well as compensatory dynamics can be seen in the primary producers. Time of species extinctions is indicated by arrows. Below the time series the specific food webs are displayed, before and after extinctions (extinct species are denoted by gray nodes and lost links by gray edges). Scenario: low correlation in species responses to environmental variation (ρ= 0.1), high environmental variation (var(ɛ) = 0.33), and weak intraspecific competition in consumers (aii=–0.001).
