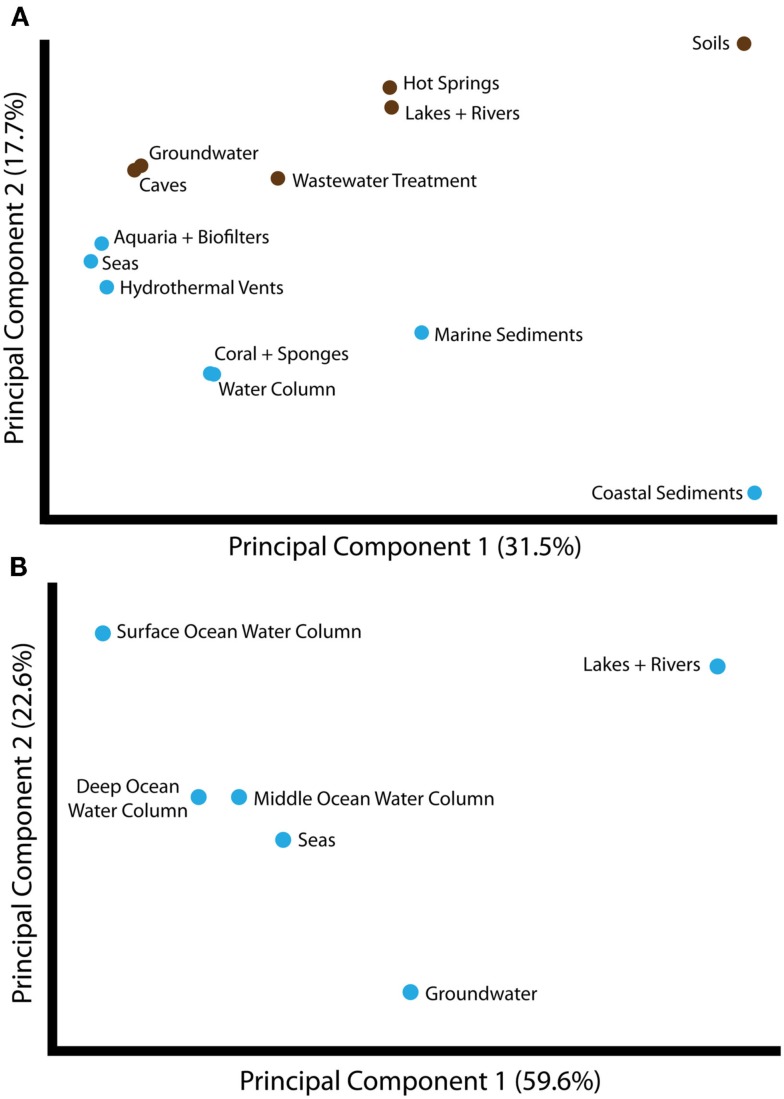
Figure 2.
Principal components analysis of unweighted Unifrac distances between different groups of amoA sequences, as categorized by habitat from which the sequences were isolated. (A) Unifrac analysis of amoA sequences from all habitats annotated in the complete amoA sequence dataset. The first two principal components account for 49% of the variation between all habitats. Unifrac analysis was conducted based on the maximum likelihood tree shown in Figure 1. Habitats are colored as either marine (blue) or freshwater/terrestrial (brown). (B) Unifrac analysis of amoA sequences from aquatic environments only. A maximum likelihood tree was computed for all unique sequences from the indicated habitats using RAxML and analyzed by Unifrac as above. The major principal component correlates with salinity.

