
Figure 3.
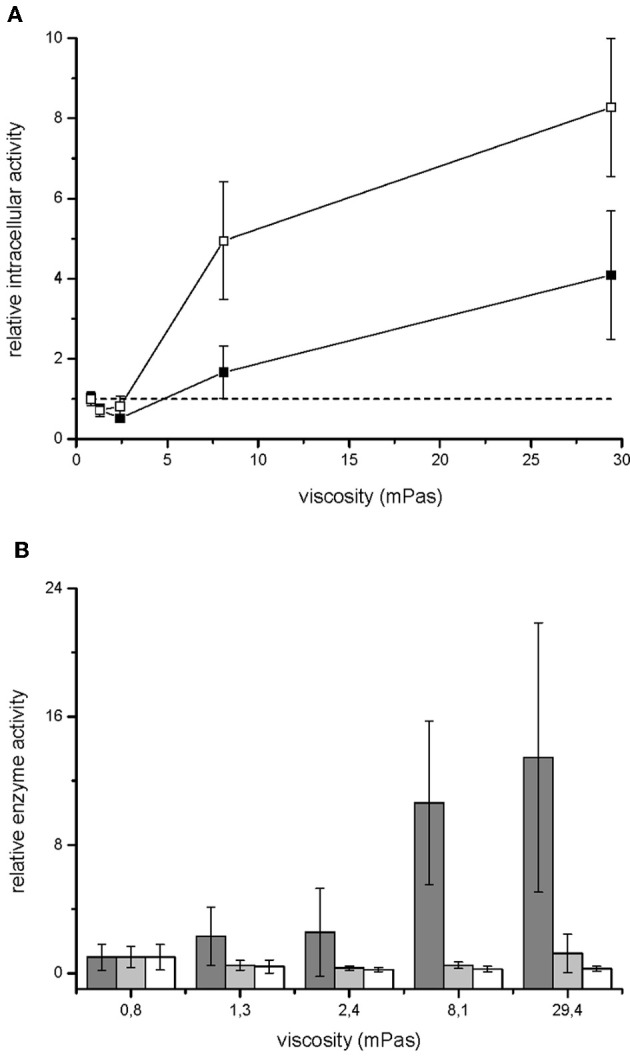
Metabolism of V. ruber grown at different viscosities. Relative respiration rate (open symbols) and dehydrogenase activity (filled symbols) of V. ruber are shown in panel (A). The values presented are means and standard deviations (n = 5). The dashed line represents metabolic activity in M9 medium. Activities of glucose-6-phosphate dehydrogenase (dark gray columns), phosphofructokinase (light gray columns) and pyruvate kinase (white columns) relative to the basal enzyme activity at 0.8 mPas are shown in panel (B). The values presented are means and standard deviations (n = 3).