
Figure 4.
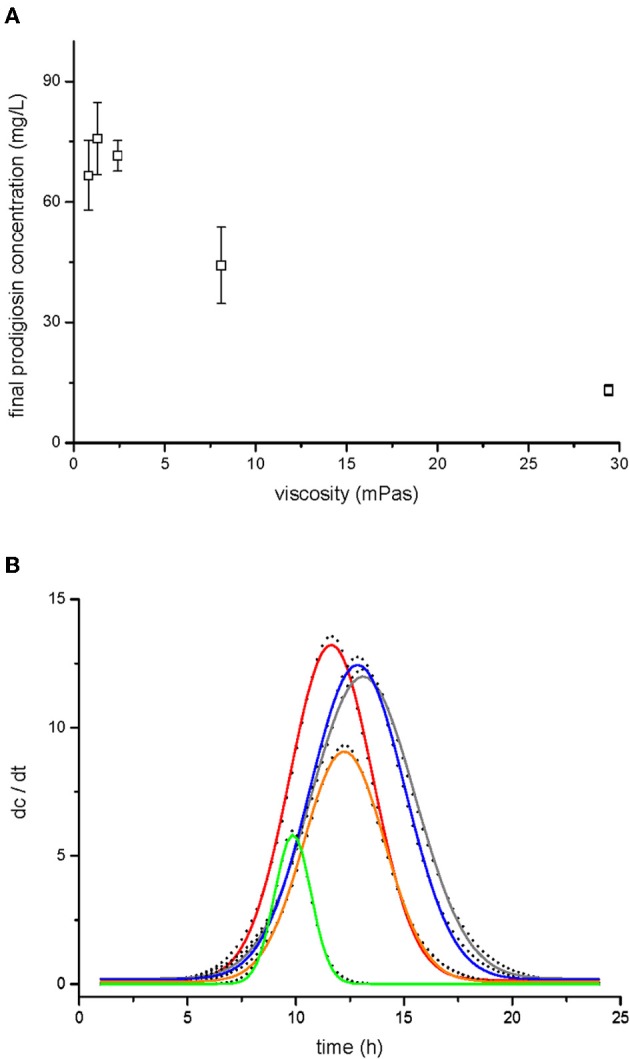
Prodigiosin production by V. ruber at different viscosities. Prodigiosin concentration after 24 h of bacterial growth is shown in panel (A). The values presented are means and standard deviations (n = 3). Dynamics of prodigiosin production are presented in panel (B). The dots represent the first derivative of prodigiosin concentration (dc/dt) and were fitted with Gaussian distribution (lines). The data presented are means of three pigment concentrations at each time of extraction. Legend: red line–0.8 mPas, gray line–1.3 mPas, blue line–2.4 mPas, orange line–8.1 mPas, green line–29.4 mPas.