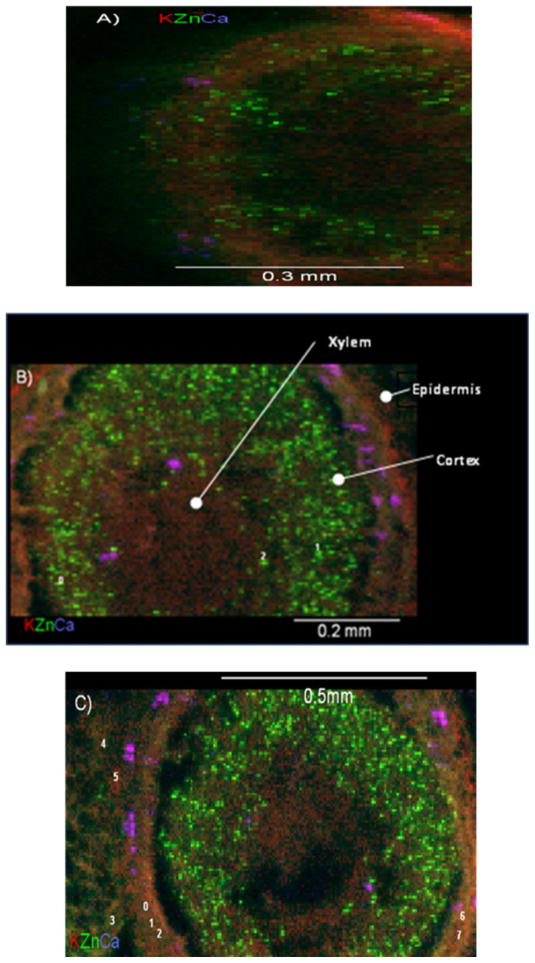
Fig. 4.
Tricolour micro-XRF images of the cross sections of (A) mesquite root control (sample of 100 μm of thickness); (B) and (C) two different mesquite roots samples treated with 1000 mg L−1 (sample of 30 μm of thickness). Red colour stands for potassium, green for zinc, and purple for calcium. In (B) and (C), bright spots are labelled with numbers from 0 to 2 and diffused spots with numbers 0 to 7. (For interpretation of the references to colour in this figure legend, the reader is referred to the web version of the article.)

