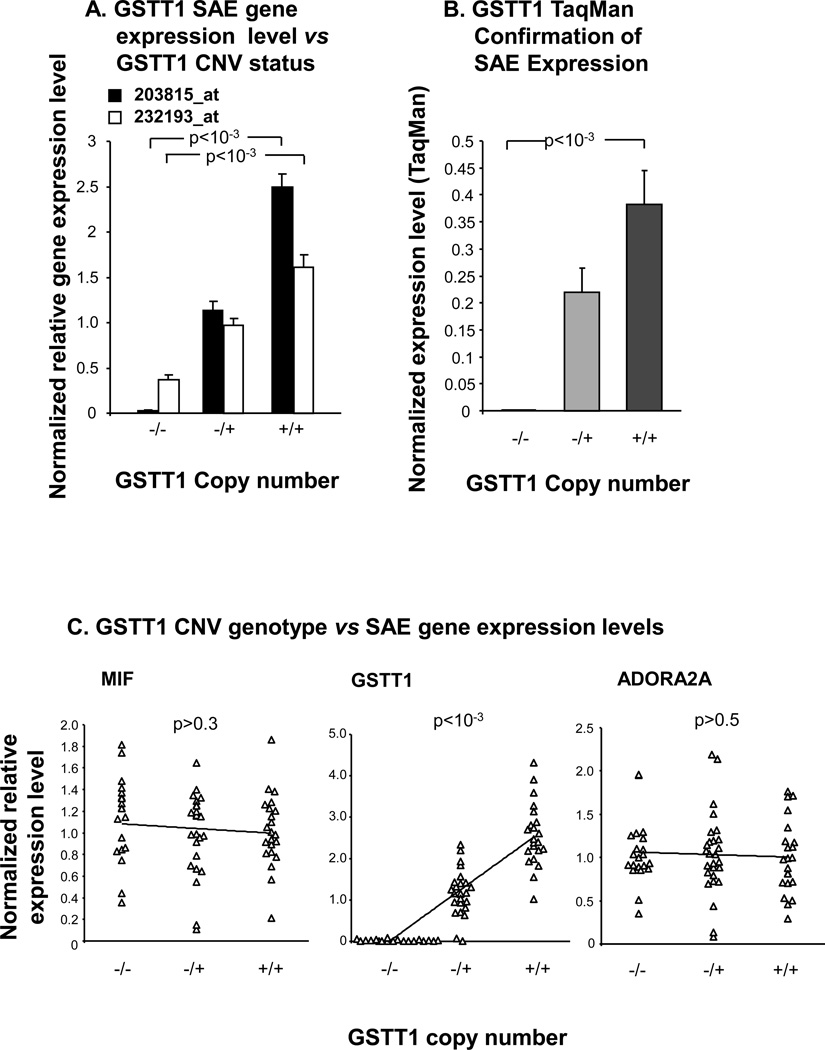
Figure 5.
GSTT1 CNV genotype versus small airway epithelium gene expression. A. For each of the two indicated Affymetrix GSTT1 gene expression probe sets, GSTT1 CNV genotype is plotted against normalized average gene expression level on the ordinate. P values represent Kruskal Wallis test. B. The normalized average expression level by TaqMan RT-PCR is shown on the ordinate versus GSTT1 copy number, for a random subset of individuals (n = 24). P value shown is a Kruskal Wallis test. C. For each of the three indicated genes, GSTT1 copy number is plotted on the abscissa versus each gene’s normalized relative expression levels on the ordinate, in the total study population (n = 70). Kendall tau rank correlation p values are shown. Error bars in panels A, B represent standard error.

