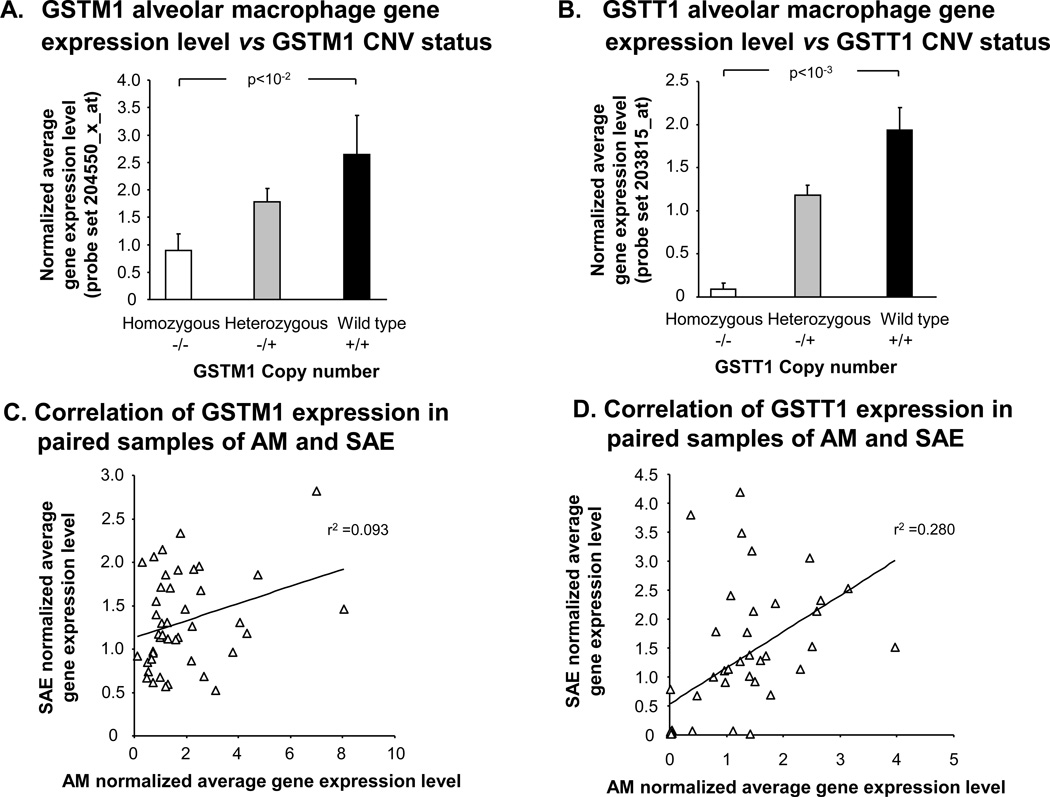
Figure 6.
Correlation of GSTM1 and GSTT1 gene expression levels in alveolar macrophages with CNV genotype. A. GSTM1 gene expression levels vs GSTM1 CNV status. Average normalized gene expression levels in AM for GSTM1 as assessed using microarray are shown on the ordinate vs GSTM1 genotype from healthy nonsmokers (n = 22) and healthy smokers (n = 34). Kruskal Wallis p value is shown. B. GSTT1 gene expression levels vs GSTT1 CNV status. AM average normalized gene expression levels of GSTT1 are shown on the ordinate for each of the indicated GSTT1 CNV genotype groups. P value represents Kruskal Wallis test. C. GSTM1 expression in SAE vs AM. For GSTM1, average normalized microarray gene expression levels in AM is plotted against SAE gene expression for the same individuals (n = 43 ). The Spearman rank correlation is shown. D. GSTT1 expression in SAE vs AM. The correlation of microarray gene expression levels of GSTT1 in the same individuals (n = 43 ) between their AM on the abscissa and SAE on the ordinate. The Spearman rank correlation is shown. Error bars represent the standard error.

