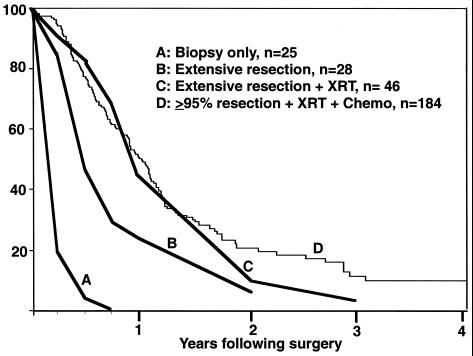
Figure 3.
Kaplan–Meier survival plots for patients diagnosed with GBM. Curves A, B, and C are historical data from Jelsma and Bucy (8) published in 1967 before the availability of MRI scans: biopsy only (A), extensive resection (undefined) (B), and extensive resection followed by radiation therapy (C). Curve D is current data from the M. D. Anderson Cancer Center on patients with >95% resection (by volumetric MRI measurements) followed by both radiation therapy and chemotherapy. Although there are essentially no long-term survivors, removal of tumor mass clearly increases longevity.

