
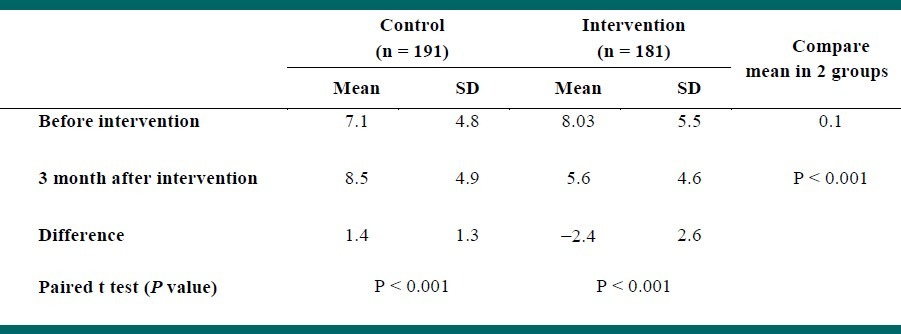
Table 2.
Distribution of mean and standard deviation scores from the total General Health Questionnaire (GHQ-28) in intervention and control group, before and 3 months after intervention
Official websites use .gov
A
.gov website belongs to an official
government organization in the United States.
Secure .gov websites use HTTPS
A lock (
) or https:// means you've safely
connected to the .gov website. Share sensitive
information only on official, secure websites.
Distribution of mean and standard deviation scores from the total General Health Questionnaire (GHQ-28) in intervention and control group, before and 3 months after intervention