
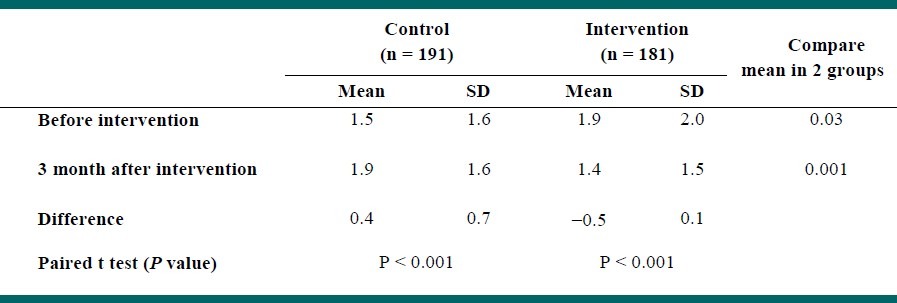
Table 5.
Distribution of mean and standard deviation scores of social dysfunction in intervention and control group, before and 3 months after intervention
Official websites use .gov
A
.gov website belongs to an official
government organization in the United States.
Secure .gov websites use HTTPS
A lock (
) or https:// means you've safely
connected to the .gov website. Share sensitive
information only on official, secure websites.
Distribution of mean and standard deviation scores of social dysfunction in intervention and control group, before and 3 months after intervention