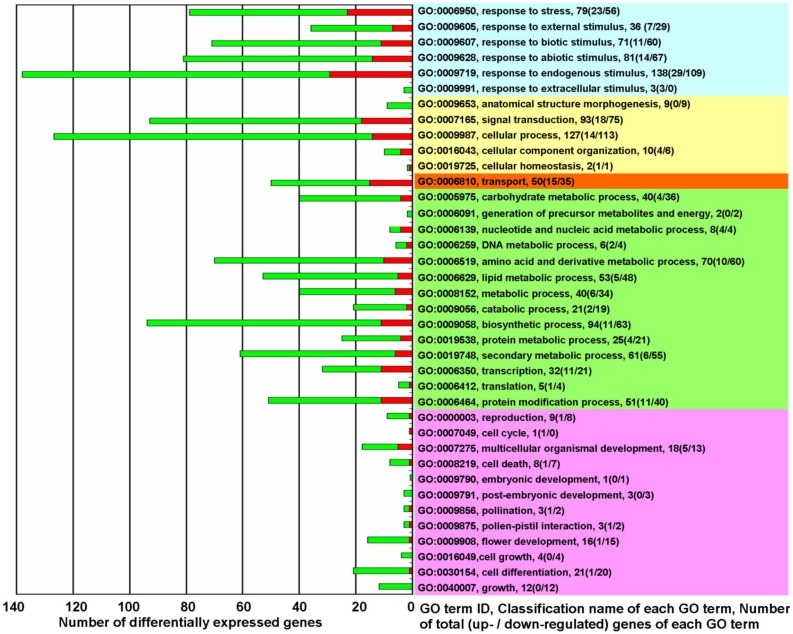
Figure 2.
The biological functions of differentially expressed genes in KMD rice★. Red square: Up-regulated genes (fold change ≥ 2.0); Green square: down-regulated genes (fold change ≤ 0.5). Right side - Light Blue: processes for response to various of stress/stimulus; Yellow: processes involved in plant physiological regulation and maintenance; Orange: processes for the directed movement of substances; Green: processes involved in metabolism; Pink: processes associated with plant growth and development. ★ please note that of the 19420 detected probes, accounting for 34.98% of all rice probes on Affymetrix GeneChip® Rice Genome Array, 718 differentially expressed probes were selected with a cut-off q-value ≤ 0.05 for 3 biological replicates and with fold change ≥ 2.0 or ≤ 0.5. There were 34 genes that were represented by 2 probes and 2 genes that were represented by 3 probes. Thus, the 718 probes represented 680 differentially expressed genes. In which 372 unclassified differentially expressed genes (144 up-regulated and 228 down-regulated) were excluded from this figure. GO term classification analysis for biological processes, based on fold change of differentially expressed genes, was performed with FDR multiple-test correction (P value cutoff = 0.05).

